Report Manager Guide
Introduction. The Wheelhouse Report Manager is designed to make reporting much easier, faster, and less expensive than traditional custom reports. This Report Designer empowers users at all skill lev…
Introduction
The Wheelhouse Report Manager is designed to make reporting much easier, faster, and less expensive than traditional custom reports. This Report Designer empowers users at all skill levels to create and manage reports efficiently, eliminating the need for extensive technical expertise.
Key Benefits
- Create reports 5x faster than custom-coded reports
- Edit reports yourself (reducing dependence on technical support)
Key Concepts
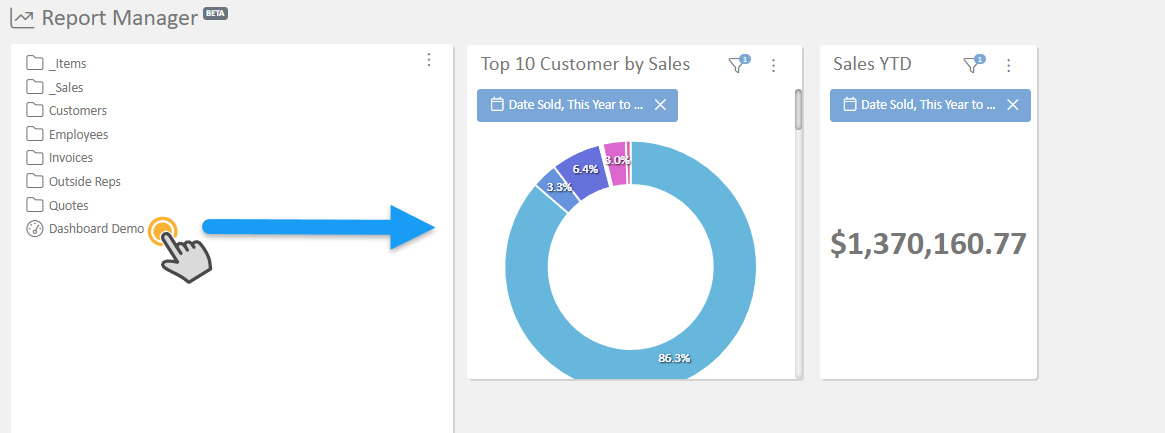
Reports vs Dashboards
- Reports: Individual data views
- Dashboards (RPM Icon): Combines multiple reports on one page
Database Structure
Think of the database as multiple Excel spreadsheets that reference each other:
- Each table (like Invoice, Customer, Item) is like a separate spreadsheet
- Tables connect through ID fields (Customer ID links invoices to customer names)
- When creating reports, you can pull fields from related tables
User Roles and Access
The Report Manager uses three levels of access:
Capability | Report Agent | Report Manager | Report Admin |
Can view reports | ✓ | ✓ | ✓ |
Can create reports | ✗ | ✓ | ✓ |
Can edit existing reports | ✗ | ✓only reports they created or have access to | ✓ |
Can share reports with other users | ✗ | ✓ | ✓ |
Can see all reports | ✗ | ✗ | ✓ |
Dashboard Access
Users can access shared dashboards even without the Report Agent role, making it easy to share specific views with team members without giving full reporting access.
Creating Your First Report
Step 1: Start a New Report
- Navigate to the Report Manager in the left menu: Reports > Reports
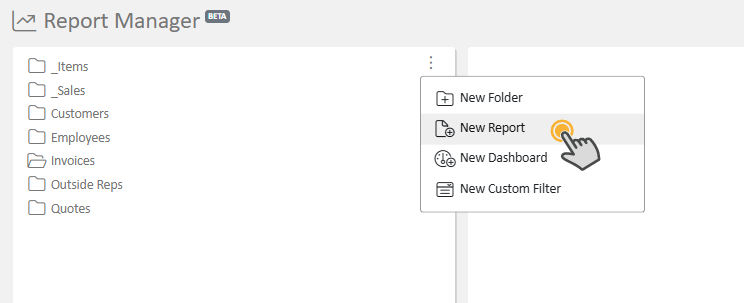
- Click the three-dot menu icon
- Select "New Report"
- Choose your base table (start with something familiar like Invoice)
Step 2: Name Your Report
- Give your report a descriptive name
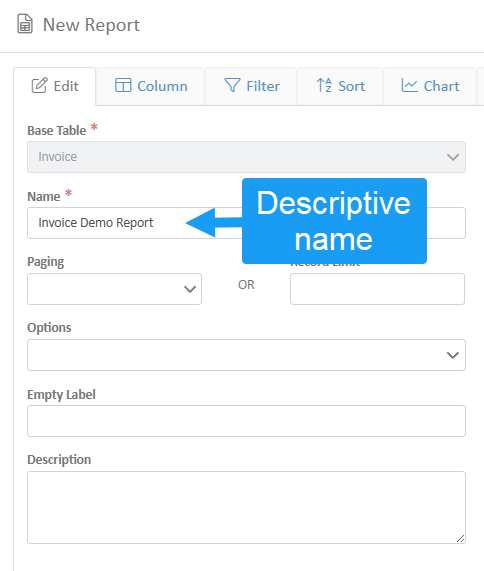
- Don't assign view access yet (keep it private while building)
Step 3: Add Columns
- Go to the "Columns" tab
- Click "Add a Column"
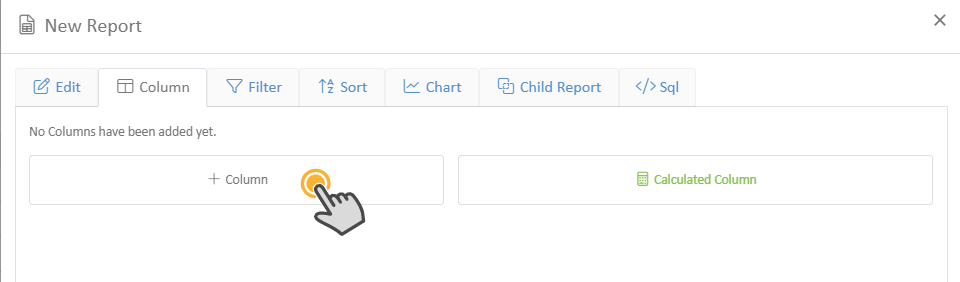
- Browse available fields:
- Direct fields: From your base table (e.g., Invoice Date)
- Related fields: From connected tables (e.g., Customer > Name)
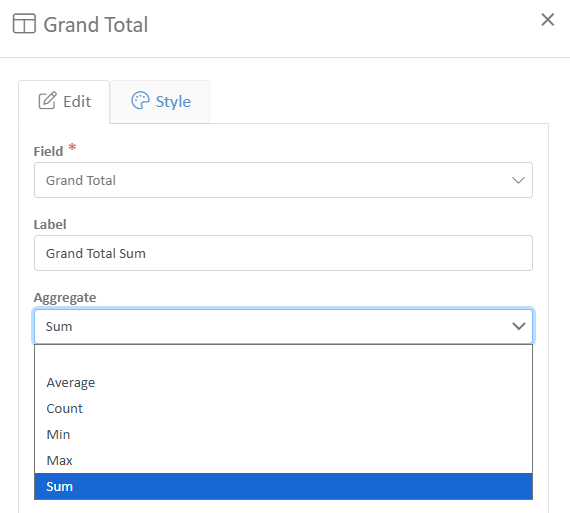
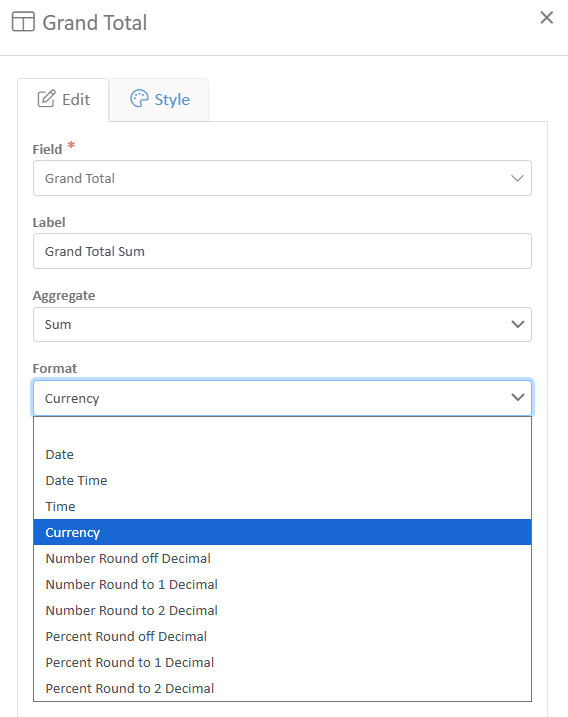
- Set a clear label
- Set aggregation (Sum totals, count records, etc.)
- Set format (date, time, currency, etc.)
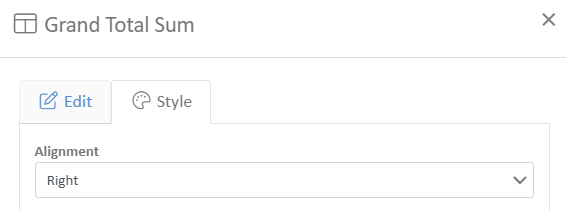
- Set style preferences in the style tab (alignment, colors, and width)
- Save by exiting the slide-out window
Step 4: Add Filters (Recommended)
- Go to the "Filter" tab
- Click "Add a Filter"
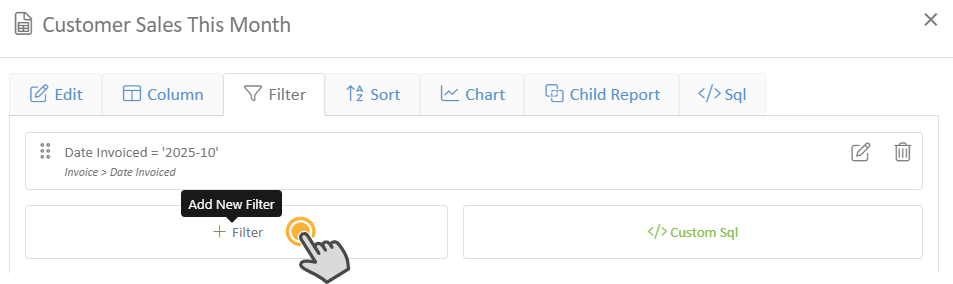
- Add date ranges to avoid pulling thousands of records
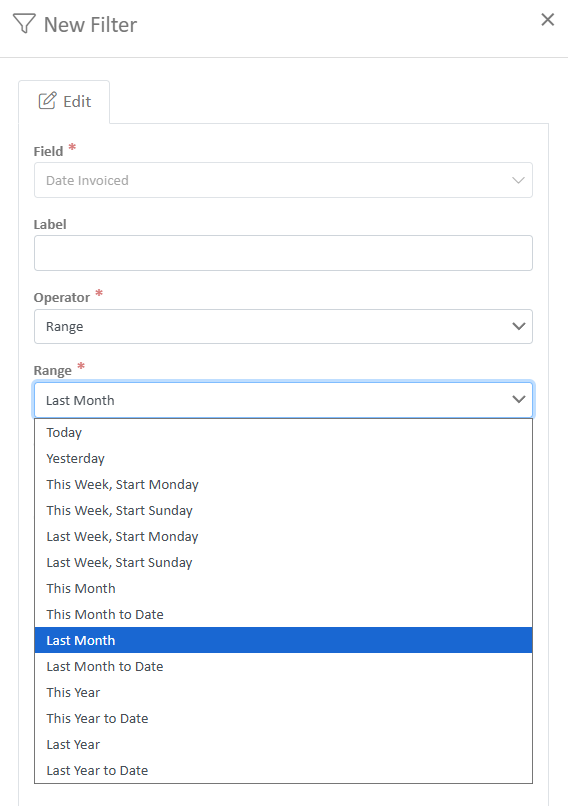
- Select a field (e.g., Date Invoiced)
- Select an operator; range is a good option here.
- Set the range of your choice (e.g., Last Month)
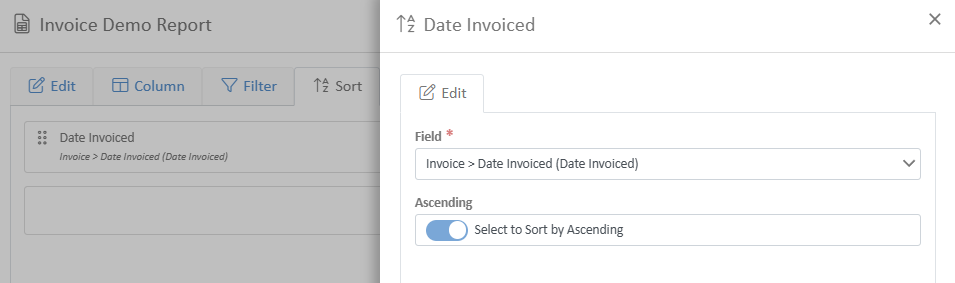
Step 5: Configure Display Options
- Sorting: Use the Sort tab to organize data (alphabetical, by value, etc.)
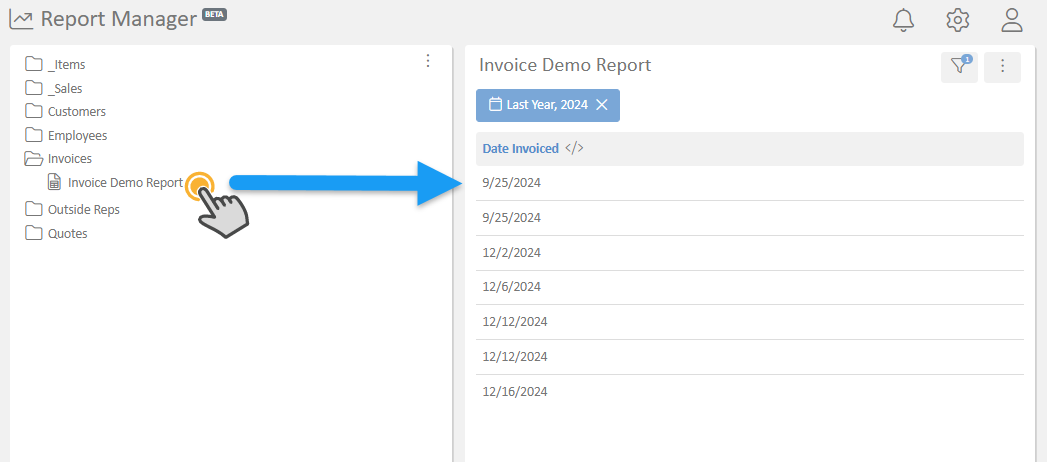
Step 6: Test Your Report
- Click away from the report editor
- Your report appears in the left menu
- Click to run and verify the results
Organizing Reports with Folders
Create Personal Organization
- Right-click in the report list or use the three-dot menu
- Select "New Folder"
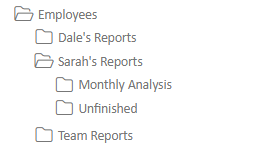
- Create folders like:
- "Your Name's Reports"
- "Unfinished Reports" (for work in progress)
- "Archived Reports" (for old reports)
Folder Management
- Drag and drop reports into folders
- Create subfolders for better organization
- Important: Other users can see folder names (even if empty) to prevent duplicate folder creation
Best Practice Structure
Building Dashboards
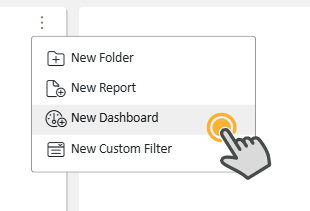
Creating a Dashboard
- Click three-dot menu -> "New Dashboard"
- Give your dashboard a name
- Go to the "Layout" tab
Adding Reports to Dashboards
- Drag report tiles onto the dashboard canvas
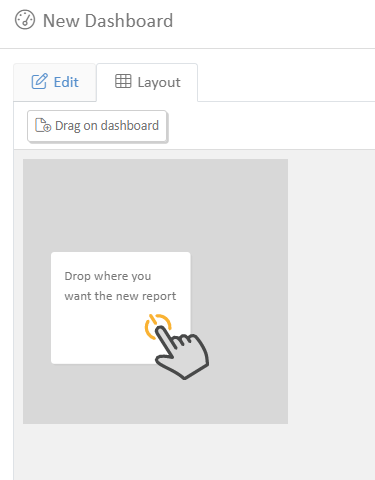
- Select which report to display in each tile
- Resize and position tiles as needed
- Preview changes by clicking the dashboard name
Reports can display as charts, tables, or both simultaneously. Dashboards consolidate all this information into a single, comprehensive view.
Dashboard Benefits
- Combine multiple related reports
- Perfect for executive summaries
- Can show charts, tables, and metrics together
- Easy way to create comprehensive overviews
Sharing Reports and Dashboards
Important Security Notes
⚠️Critical: Only Report Admins and Report Managers can share reports and dashboards
⚠️Data Security: Always verify filters before sharing to ensure users only see appropriate data
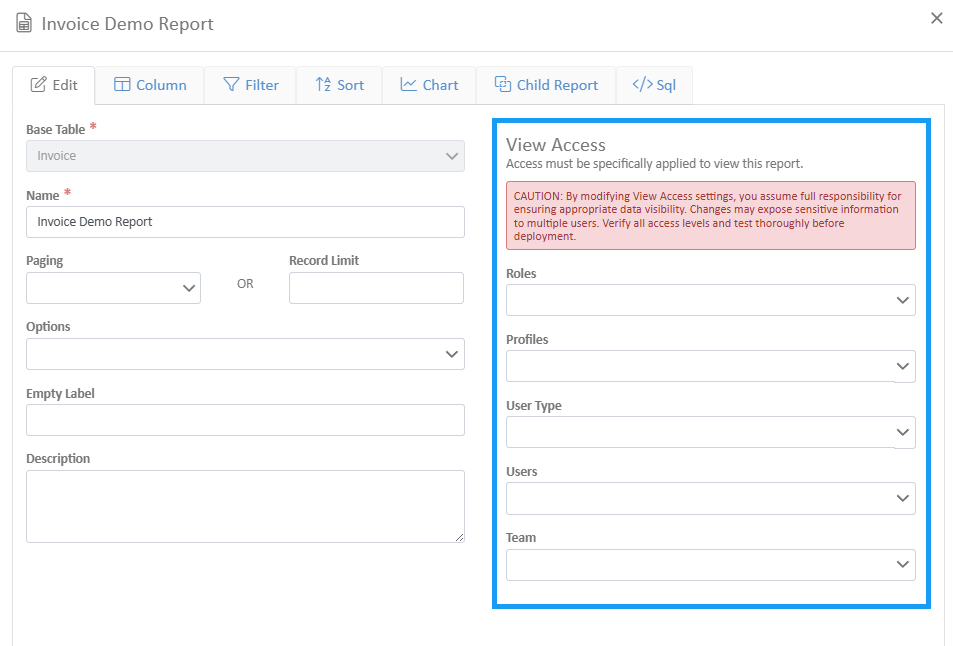
Sharing Process
- Edit the report or dashboard
- Go to the "View Access" section
- Choose the sharing method:
- By Role: Share with all users having a specific role
- By Profile: Share with users having a specific profile
- By Individual: Share with specific users
- By Team: Share with defined team groups
Special Filters for User-Specific Data
For reports that should show different data per user (like rep reports):
- Use filters like "Outside Rep is Logged in User"
- This automatically filters data to show only what the current user should see
- Essential for maintaining data security
Advanced Features
Aggregation and Totals
- Sum: Add up numeric values (great for sales totals)
- Count: Count the number of records
- Average: Calculate averages
- Total Rows: Add summary rows to reports
Paging vs. Total Rows
- With Paging: Shows a subset of data, loads faster
- Without Paging: Shows all data, better for totals
- Warning: Total rows with paging only show page totals, not grand totals
Child Reports (Drill-Down)
- Add expandable sections to reports
- Click the expand button to see detailed records
- Example: Customer summary with expandable invoice details
Export Options
- Export to Excel for further analysis
Best Practices
Development Workflow
- Start Private: Create reports without view access initially
- Test Thoroughly: Verify data accuracy and performance
- Organize First: Put reports in appropriate folders
- Get Review: Have another person check filters and sharing before going live
Data Security
- Always filter appropriately before sharing
- Double-check user access - you can potentially share all company data
- Use role-based sharing when possible for easier management
- Get a second opinion on sensitive reports
Performance Tips
- Use date filters to limit record sets
- Avoid unnecessary columns to improve loading speed
- Use paging for large datasets on dashboards
- Reset reports if changes don't appear (browser caching issue)
Naming Conventions
- Use descriptive names: "Invoice by Customer - This Month", not "Report1"
- Include time periods in names when relevant
- Be consistent across your team
Troubleshooting
Report Not Loading/Updating
Solution: Click the "Reset" button
- Browser caching can prevent changes from showing
- Reset forces a fresh data pull
Changes Not Appearing
- Make sure you saved the report
- Try the Reset button
- Check if you're editing the right report
Performance Issues
- Add date filters to limit data
- Remove unnecessary columns
- Consider using paging for large datasets
- Check if you're pulling from very large tables
Access Issues
Dashboard not appearing in tab:
- Set 'View Access' on the dashboard to include yourself
- If the user doesn't have access to a report on their dashboard, they will see a note that "they don't have access to view the report".
Data Not Showing as Expected
- Check your filters - are they too restrictive?
- Verify date ranges - are you looking at the right time period?
- Check table relationships - are you pulling from the right connected tables?
Getting Help
When to Contact Support
- Complex calculations that require custom coding
- Performance issues with large datasets
- Setting up advanced filtering for user-specific data
- Questions about database structure and table relationships
What to Include in Support Requests
- Report name you're working on
- Specific question or issue
- Screenshots if applicable
- What you're trying to accomplish
Email Support
Send questions to: support@wheelhousemfg.com
Summary
The Report Manager puts powerful reporting capabilities in your hands while maintaining proper data security. Start with simple reports, organize them well, and always verify your data and sharing settings before making reports available to others.
Remember: With great reporting power comes great responsibility - Always double-check your filters and sharing permissions to protect sensitive company data. The system is designed to grow with your needs, from simple data exports to complex executive dashboards. Take time to master the basics, and you'll find it becomes an invaluable tool for business insights and decision-making.
How did we do?
How to Modify Document Templates